【作者前言】
对于科技工作者来说,gnuplot 是一个非常好用的绘图软件。因为感慨于gnuplot 中文资料和文档的缺乏,我于数月之前在科学网博客开始撰写“谈谈gnuplot”系列博文,至今已写了四十五篇。
虽然还有不少细节问题没有涉及,但是我觉得这些博文已经可以构成一个比较完整的gnuplot 中文教程。对大多数用户来说,这一系列博文已经涵盖了日常应用的需要。为了方便大家阅读,我现在将这一系列博文集结编辑成为此教程,以CC BY-NC-SA 知识共享协议发布。
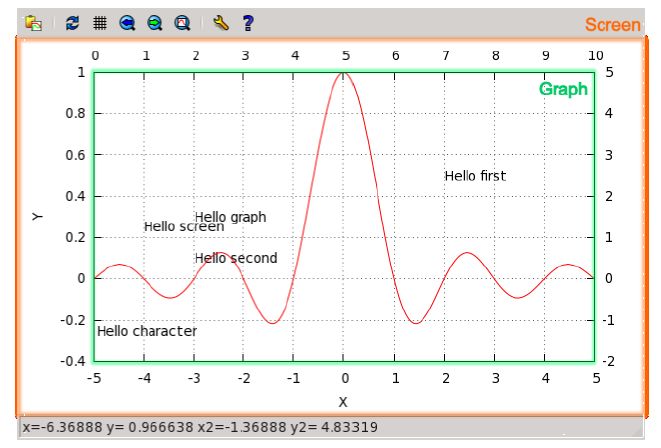
我们现在知道了gnuplot 有第一(first)和第二(second)两套坐标系统,但是gnuplot 的坐标系统还不止于此。除此之外,它还有graph,screen 和character 三套坐标系统。graph 和screen 都是归一化的坐标系统。graph 以坐标轴包围区域为界,左下角为0,0,右上角为1,1;screen 以整个图片区域为界,左下角为0,0,右上角为1,1。
character 顾名思义,是以字符大小为单位长度的坐标系统,因此它的单位长度依赖于字体大小。它的原点位置和screen 相同。
下面我们结合label 命令来了解一下这几个坐标系统。我们之前讲过xlabel 和ylabel。而这里的label 命令,是在图中任何地方插入文字标签。还是来看例子:
gnuplot> sinc ( x ) = sin ( pi x ) /( pi x )
gnuplot> set xlabel “X”
gnuplot> set ylabel “Y”
gnuplot> unset key
gnuplot> set samples 500
gnuplot> set xrange [-5:5]
gnuplot> set xtics 1
gnuplot> set x2range [ 0 : 1 0 ]
gnuplot> set x 2tics 1
gnuplot> set y2range [-2:5]
gnuplot> set y 2tics 1
gnuplot> set grid
gnuplot> set label 1 “Hell o ␣ first ” at 2 , 0 . 5
gnuplot> set label 2 “Hell o ␣ second ” at second 2 , 0 . 5
gnuplot> set label 3 “Hell o ␣ graph” at graph 0 . 2 , 0 . 5
gnuplot> set label 4 “Hell o ␣ screen ” at screen 0 . 2 , 0 . 5
gnuplot> set label 5 “Hell o ␣ character ” at character 10 ,5
gnuplot> plot sinc ( x )
这里我们画一个sinc 函数图像。为了说明问题,我们把第二坐标系也都标示了出来,虽然函数图像并没有用到第二坐标。其他命令前面都讲过了,这里只看五个set label 命令。set label 之后紧跟的那个整数,就是一个标识符,用以区别各个label,可以随便选个整数。在字符串之后,at 参数指定标签坐标。默认为first 坐标系统,也可以使用其它坐标系统。下面是生成的图片:

为了帮助大家理解,我们把graph 和screen 各自的坐标区域分别用绿色和橙色表示了出来。
标签文字的默认对齐方式为居左,也就是指定的坐标位置在文字的左边。我们也可以在label命令里选择其他对齐方式。除此之外,我们还可以在label 命令里指定文字颜色,旋转文字,或者在指定坐标位置处加一个点。下面例子中的每个参数不必一一解释了,因为和我们前面接触过的命令都是一致的:
gnuplot> set label 1 “Hello ␣ red ␣ left ” at 2 , 0 . 4 left text color rgb “#FF0000”
gnuplot> set label 2 “Hello ␣ green ␣ center ” at 2 , 0 . 5 center text color rgb “#00FF00”
gnuplot> set label 3 “Hello ␣ blue ␣ right ” at 2 , 0 . 6 right textcolor rgb “#0000FF”
gnuplot> set label 4 “Hello ␣ rotate ” at -2 ,0.4 rotate by 45
gnuplot> set label 5 “Hello ␣ point ” at -3 ,0.2 point pt 7 lc rgb “#FF9900”
gnuplot> replot

本文整理自马欢老师科学网博客,特此感谢原作者的分享。
想看到Gunplot实际操作?”基于CP2K电子结构理论计算线上培训班”回放视频现已上线,CP2K开发和应用者兰晶岗博士主讲,内容涵盖Linux入门知识,密度泛函/优化方法/自洽场, 使用数据库构建晶体模型,表面吸附/过渡态理论。长达13个小时的实操讲解,100%好评率,精彩不容错过!
课程试听请戳:https://ke.qq.com/course/270047

原创文章,作者:菜菜欧尼酱,如若转载,请注明来源华算科技,注明出处:https://www.v-suan.com/index.php/2023/12/01/abc59f7157/
